
The GSAx Paradox
The analytics community's preferred goaltending metric is less reliable than the one it was designed to improve. 550 consecutive-season pairs across 18 years explain why.
The analytics community's preferred goaltending metric is less reliable than the one it was designed to improve. 550 consecutive-season pairs across 18 years explain why.
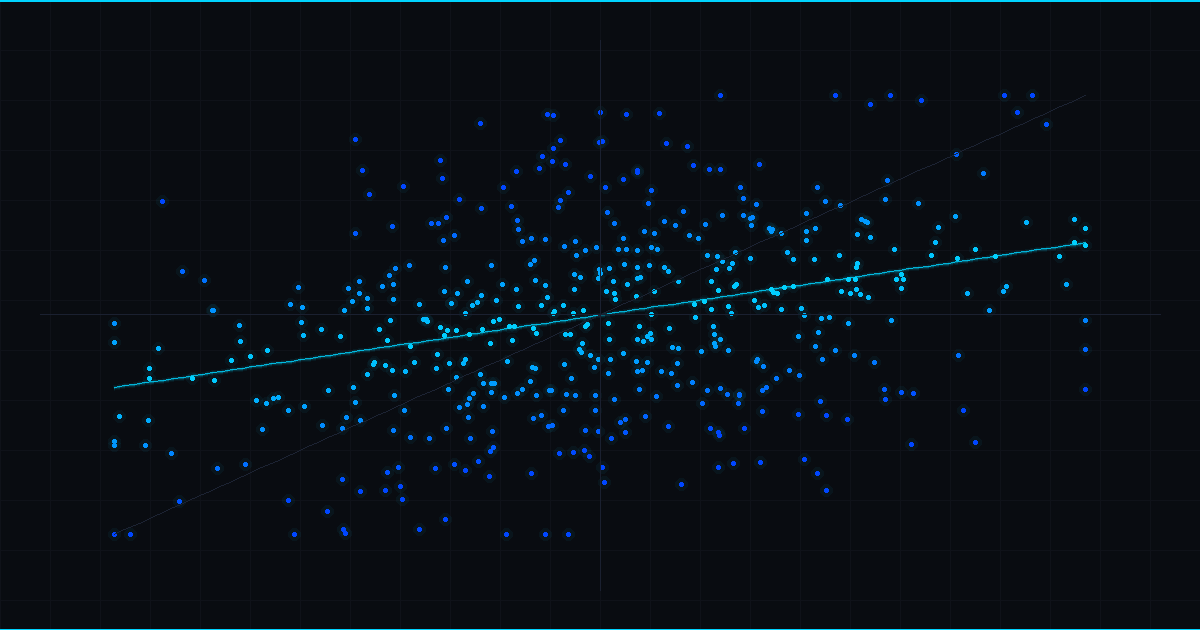
1,869 goalie-seasons. 18 years. The year-to-year correlation for save percentage is r = 0.33. Only 11% of the variance is real. The rest is a mirage.
No schedule. No filler. Just original sports analytics, transparent methodology, and findings that survived real scrutiny.
SubscribeFree. No spam. Unsubscribe anytime.