
The most dominant team in the NHL has a moderate entropy profile. That tells us something important.
- •Colorado - the best team in hockey - has a perfectly average entropy profile (rank 11 of 32)
- •Dominance doesn't require entropy extremity: Colorado excels through talent, coaching, and volume, not shot selection discipline
- •The defensive entropy hypothesis fails to replicate across 8 seasons (r = -0.020, p = 0.76)
- •Entropy is a stable trait, but being a stable trait does not make it a performance predictor
- •The most important finding in this series is what we got wrong - and the transparent correction of the record
The Exception
In Part 1, I showed that shot location entropy is a real, stable team trait, persistent year over year, reflecting genuine organizational choices about offensive structure. In Part 2, I showed that the teams with the most disciplined shot selection, the lowest entropy, are among the worst in the NHL. Volume beats precision.
But throughout both posts, one team kept showing up in the middle of the charts, unremarkable in entropy, unremarkable in shot selection discipline, and utterly dominant in every outcome that matters.
Colorado.
Through the Olympic break, Colorado has the best 5v5 offense in the NHL (2.84 goals per game) and the second-best 5v5 defense (1.60 goals against per game). Their shot location entropy is 0.825 — rank #11 of 32. Perfectly moderate.
If entropy explained winning, Colorado would be an outlier. They're not. They're exactly where you'd expect an average-entropy team to be — except they're dominant. That gap between what an entropy-first interpretation would lead you to expect and what Colorado actually does is the most instructive result in the analysis.
Colorado's Profile
Here's what makes Colorado interesting. They don't excel in any single entropy dimension. They excel at everything else.
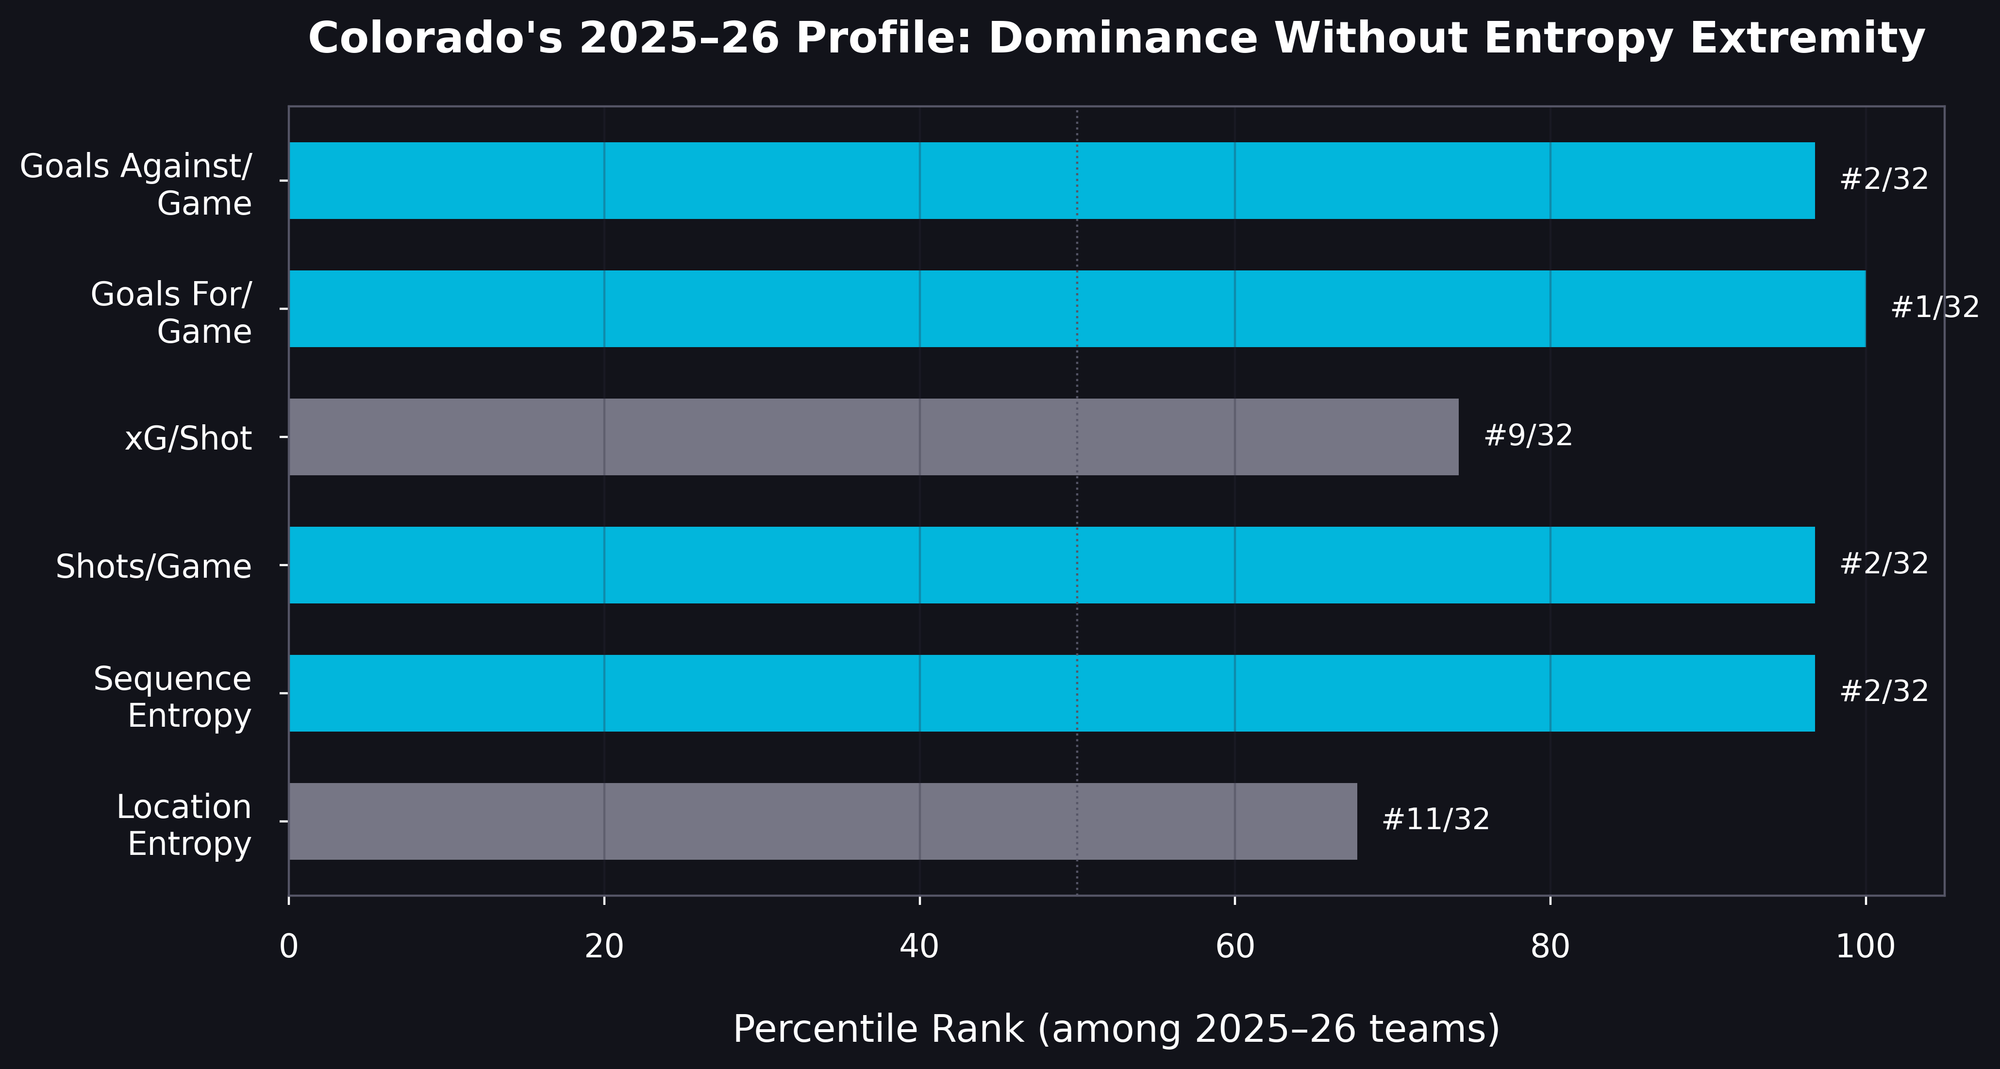
Their location entropy is moderate, ranking 11th of 32 in shot concentration, meaning they're somewhat focused but far from extreme. Their sequence entropy (Shannon entropy over discretized shot-sequence pattern categories) is elite, ranking 2nd of 32, meaning their shot sequences are among the most varied in the league. They generate the second-most shots per game in the NHL. Their shot quality per shot is decent, but not elite.
And yet, they're the best offense and second-best defense in hockey. The gap between their entropy profile and their results tells you exactly what entropy can and cannot do.
Colorado is great because they are talented, well-coached, and generate enormous shot volume from good locations. Their entropy profile is moderate, not extreme. Dominance doesn't require entropy extremity.
The Tempting Hypothesis
When you see the best team in hockey, the instinct is to look for the metric that explains them. And there's an appealing story that can be told about entropy and defense: a team that runs predictable offensive patterns has players who always know where they're supposed to be. When possession changes, they're already positioned for defense. Low entropy buys you free defense.
It's elegant. It's intuitive. A contributor proposed exactly this hypothesis. So I tested it across all eight seasons: 253 team-season observations and 18,752 game-level observations (with repeated measures by team, so inference is interpreted cautiously).
It doesn't work.
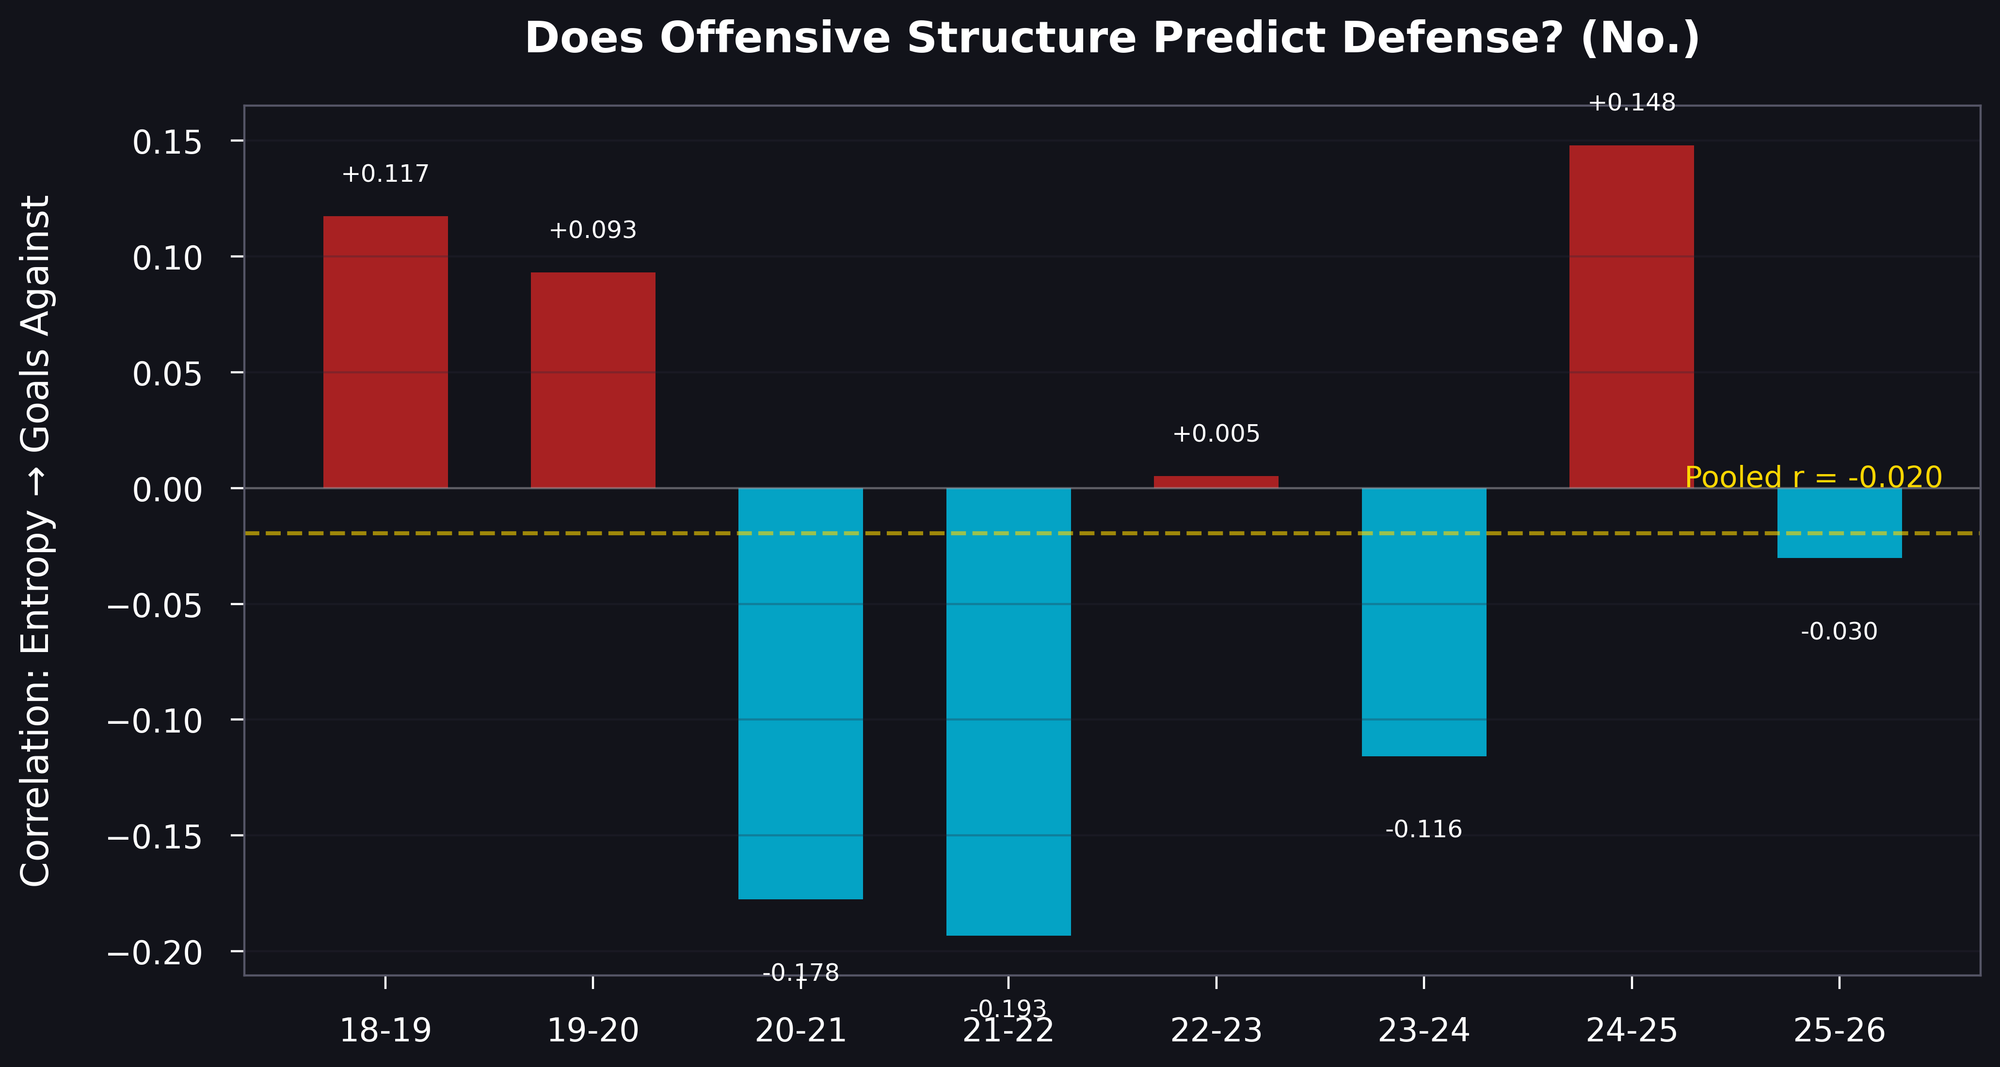
Location entropy shows no meaningful association with goals against in this analysis. The pooled within-season correlation is r = −0.020, p = 0.76. Across eight seasons, only 44% of individual season correlations point in the expected direction — essentially a coin flip.
The sequence-entropy version initially looked promising — more varied sequences appeared to correlate with fewer goals against. But the same volume confound from Part 2 reappeared: teams that generate more shots also tend to have higher observed sequence entropy and spend more time in the offensive zone, which reduces defensive exposure. Once shot volume is controlled, the relationship disappears.
In this dataset, entropy does not show a robust independent association with goals against after accounting for shot volume. The hypothesis was theoretically appealing, but this specific test did not support it. This does not rule out entropy–defense relationships in more proximal defensive process outcomes (e.g., xGA/60 or shot suppression), which should be tested separately
Why This Matters
The Colorado problem isn't really about Colorado. It's about the limits of any single metric and the temptation to overextend a finding beyond what the data supports.
Here's what we established across this three-part series:
- Shot location entropy is a genuine, stable team trait. It persists year over year with an average correlation of r = +0.57 across seven seasonal transitions. It reflects real organizational choices, coaching philosophy, personnel deployment, strategic intent.
- It has one confirmed association: lower entropy predicts higher expected goals per shot (partial r = −0.164, p = 0.009). Teams that concentrate their shooting from dangerous zones generate better-quality chances.
- But it does not show robust independent associations with winning, goals against, or scoring outcomes beyond the xG/shot relationship described above. The teams with the best shot discipline are among the worst in the league. The best team in hockey has a moderate entropy profile. And the appealing story about entropy enabling defense has no empirical support across eight seasons.
- Entropy is one input among many. Goaltending, special teams, defensive systems, player talent, health, and coaching all contribute independently. A metric that captures one dimension of offensive organization should not be expected to explain multifactorial outcomes.
The Bigger Picture
This is, in a way, the founding principle of this entire site. The conventional metrics tell you what happened. The unconventional ones, borrowed from information theory, physiology, control engineering, tell you something about structure. Structure is real. Structure persists. But structure alone doesn't determine outcomes.
Colorado teaches us that dominance is multifactorial. You can't reduce the best team in hockey to a single number. You can't explain their defense through their offense. You can't account for their results from shot locations alone. What you can do is measure the structural choices they make, and understand that those choices sit alongside talent, coaching, depth, and fortune in the messy, beautiful, irreducible complexity of team sport.
Not every metric has to predict championships. Some metrics describe structure. Understanding how a team attacks, even if it doesn't tell you whether they'll win, is still worth knowing. It's still real. It's just not everything.
The purpose of analysis is not to find the one number that explains winning. It is to understand, with precision and honesty, what each number actually tells you — and where it stops.
All data from MoneyPuck.com's shot-level dataset, 2018–19 through 2025–26 (partial season). Analysis restricted to 5v5 situations, excluding blocked shots (i.e., unblocked shot attempts). Shot coordinates are arena-adjusted using the Schuckers-Curros method. The defensive hypothesis is evaluated using within-season z-scores and partial correlations controlling for shots per game across 253 team-season observations; game-level summaries are also reported for context. Because teams contribute repeated observations across seasons/games, these results should be interpreted as association tests rather than causal estimates. Goals against is a deliberately strict but noisy endpoint influenced by goaltending and finishing variance. Quadrant labels are communication devices; the underlying conclusion is continuous: low volume dominates the team-level outcome signal across the entropy range.
This is Part 3 of a three-part series.
Part 1: What Shot Entropy Actually Measures — the one finding that survived eight seasons.
Part 2: The Concentration Trap — why the NHL's most disciplined offenses are its worst.