
253 team-seasons reveal a paradox: the teams that take the best shots finish last.
- •The NHL's most disciplined offenses (lowest entropy, most concentrated shot selection) are among its worst performers
- •Four offensive archetypes emerge: SNIPER (rare unicorn), CHAOS (workhorse), SELECTIVE (the trap), and LOST
- •Volume compensates for shot selection in a way that shot selection cannot compensate for volume - the NHL is a volume game first
- •Carolina's 8-season commitment to high-volume CHAOS validates the approach: 40+ shots per game, consistently elite
- •Three original claims retracted after robustness testing revealed rink-recording bias artifacts
The Paradox
In Part 1, I established two things about shot location entropy. First, it's a genuine team trait that is stable year over year, reflecting real organizational choices about offensive structure. Second, it has one confirmed association: lower entropy is associated with higher expected goals per shot. Teams that concentrate their shooting from dangerous zones generate better-quality chances.
The natural conclusion is that teams with the lowest entropy should be the best. They're taking the smartest shots. They're avoiding the low-percentage garbage from the point and the sharp-angle nonsense from below the circles. They should be winning.
They're not. They're losing. Badly.
The Four Archetypes
The insight comes from crossing two dimensions: where a team shoots (location entropy) and how much they shoot (shots per game). I standardized both within each season and classified every team-season from 2018–19 through 2025–26 into descriptive quadrants for visualization and interpretation. Four offensive archetypes emerge.
SNIPER (concentrated + high volume): 8 team-seasons in 8 years. The unicorn.
CHAOS (scattered + high volume): 34 team-seasons. The workhorse.
SELECTIVE (concentrated + low volume): 37 team-seasons. The trap.
LOST (scattered + low volume): 13 team-seasons.
The performance gaps are enormous:
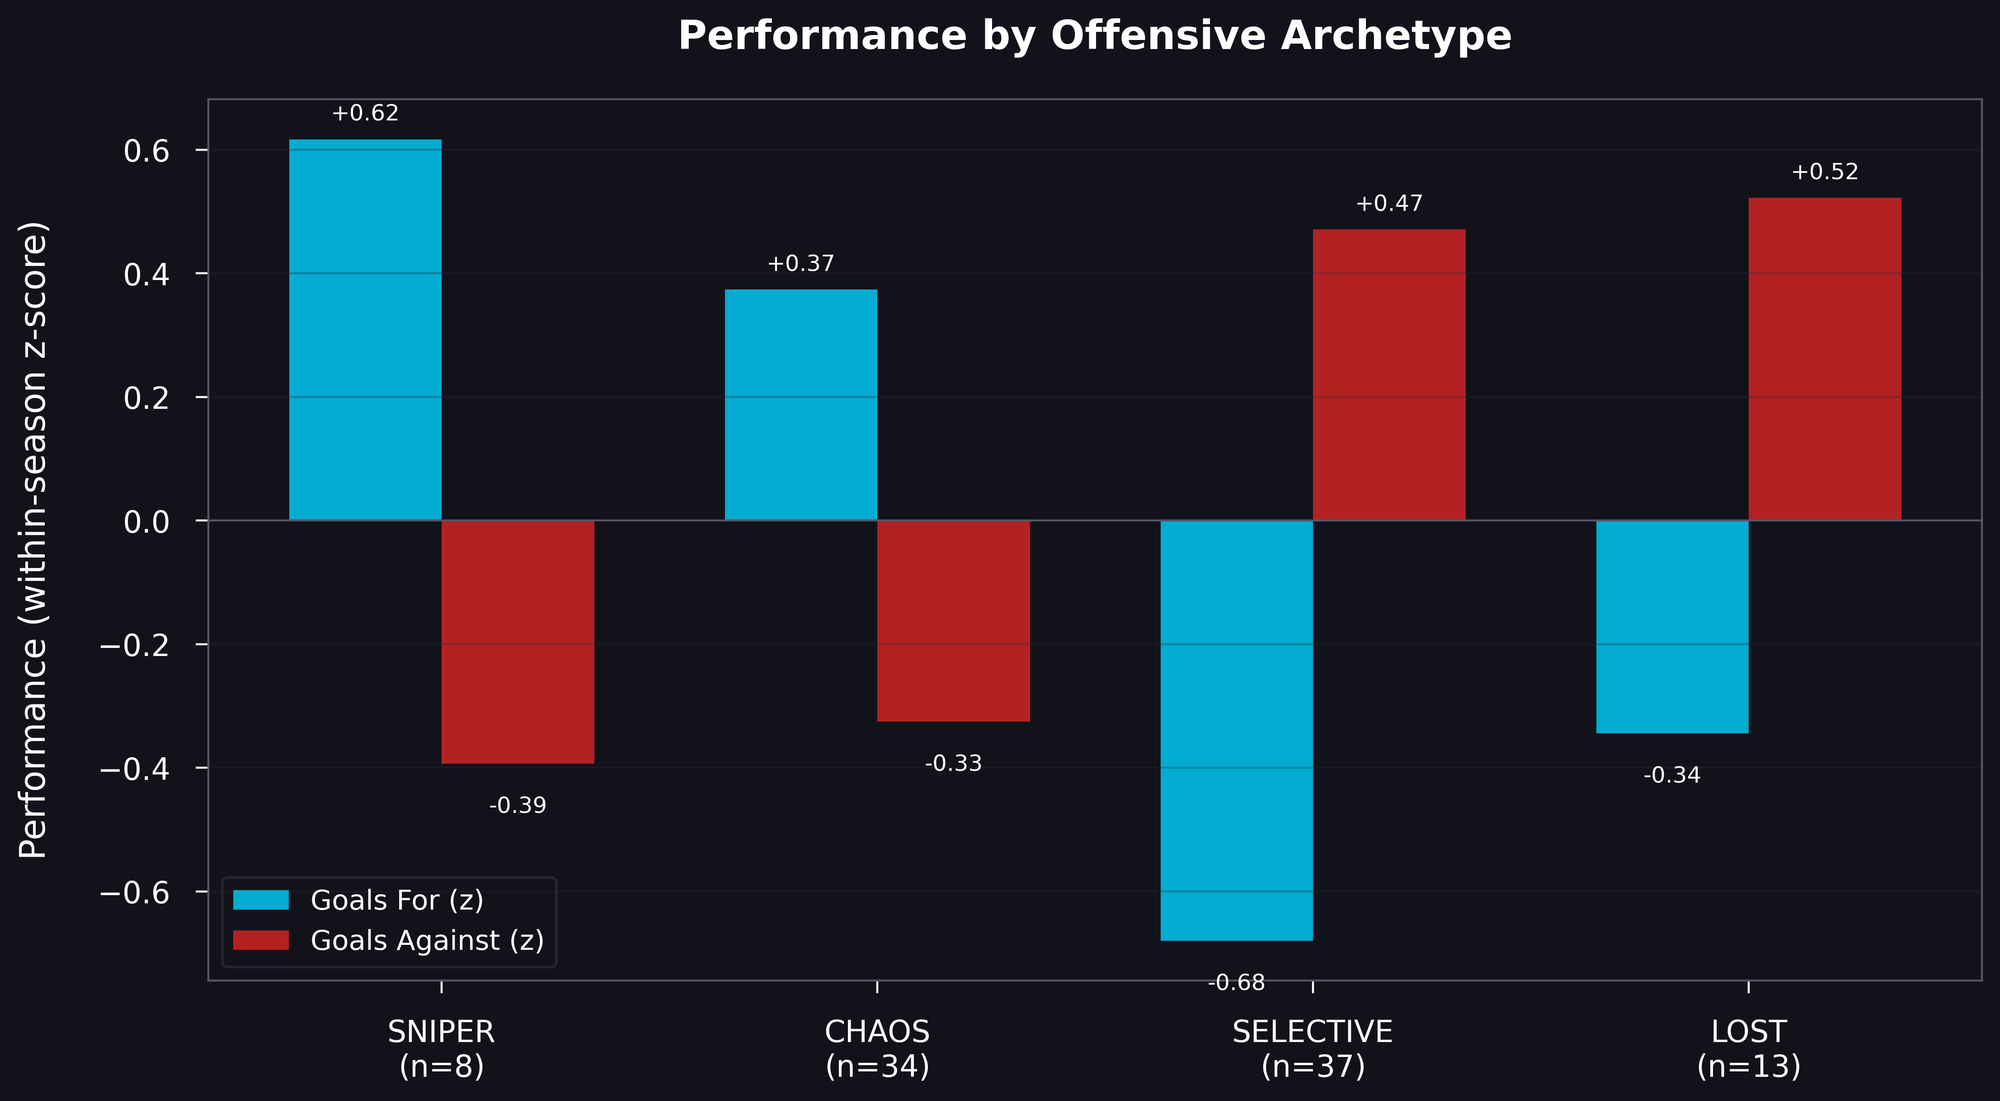
Look at the SELECTIVE bar. Teams doing exactly what shot quality theory says they should, concentrating shots from dangerous areas, are the worst offensive archetype in the NHL. Worse than the LOST teams who do everything wrong. Their net goal differential is a full standard deviation below league average.
The reason is straightforward once you see it: concentration without volume is a losing formula. These teams avoid bad shots, which is smart. But they also don't generate enough total shots, which is fatal. These teams pair shot concentration with low shot generation, a combination that is consistent with less sustained offensive-zone time and weaker overall puck control.
At the team level in this dataset, shot volume compensates for shot selection more than shot selection compensates for low volume. In that sense, NHL offense behaves like a volume-constrained system first.
Carolina's 40-Shot Manifesto
If SNIPER is the unicorn, CHAOS is the workhorse. And no team has committed to it like Carolina.
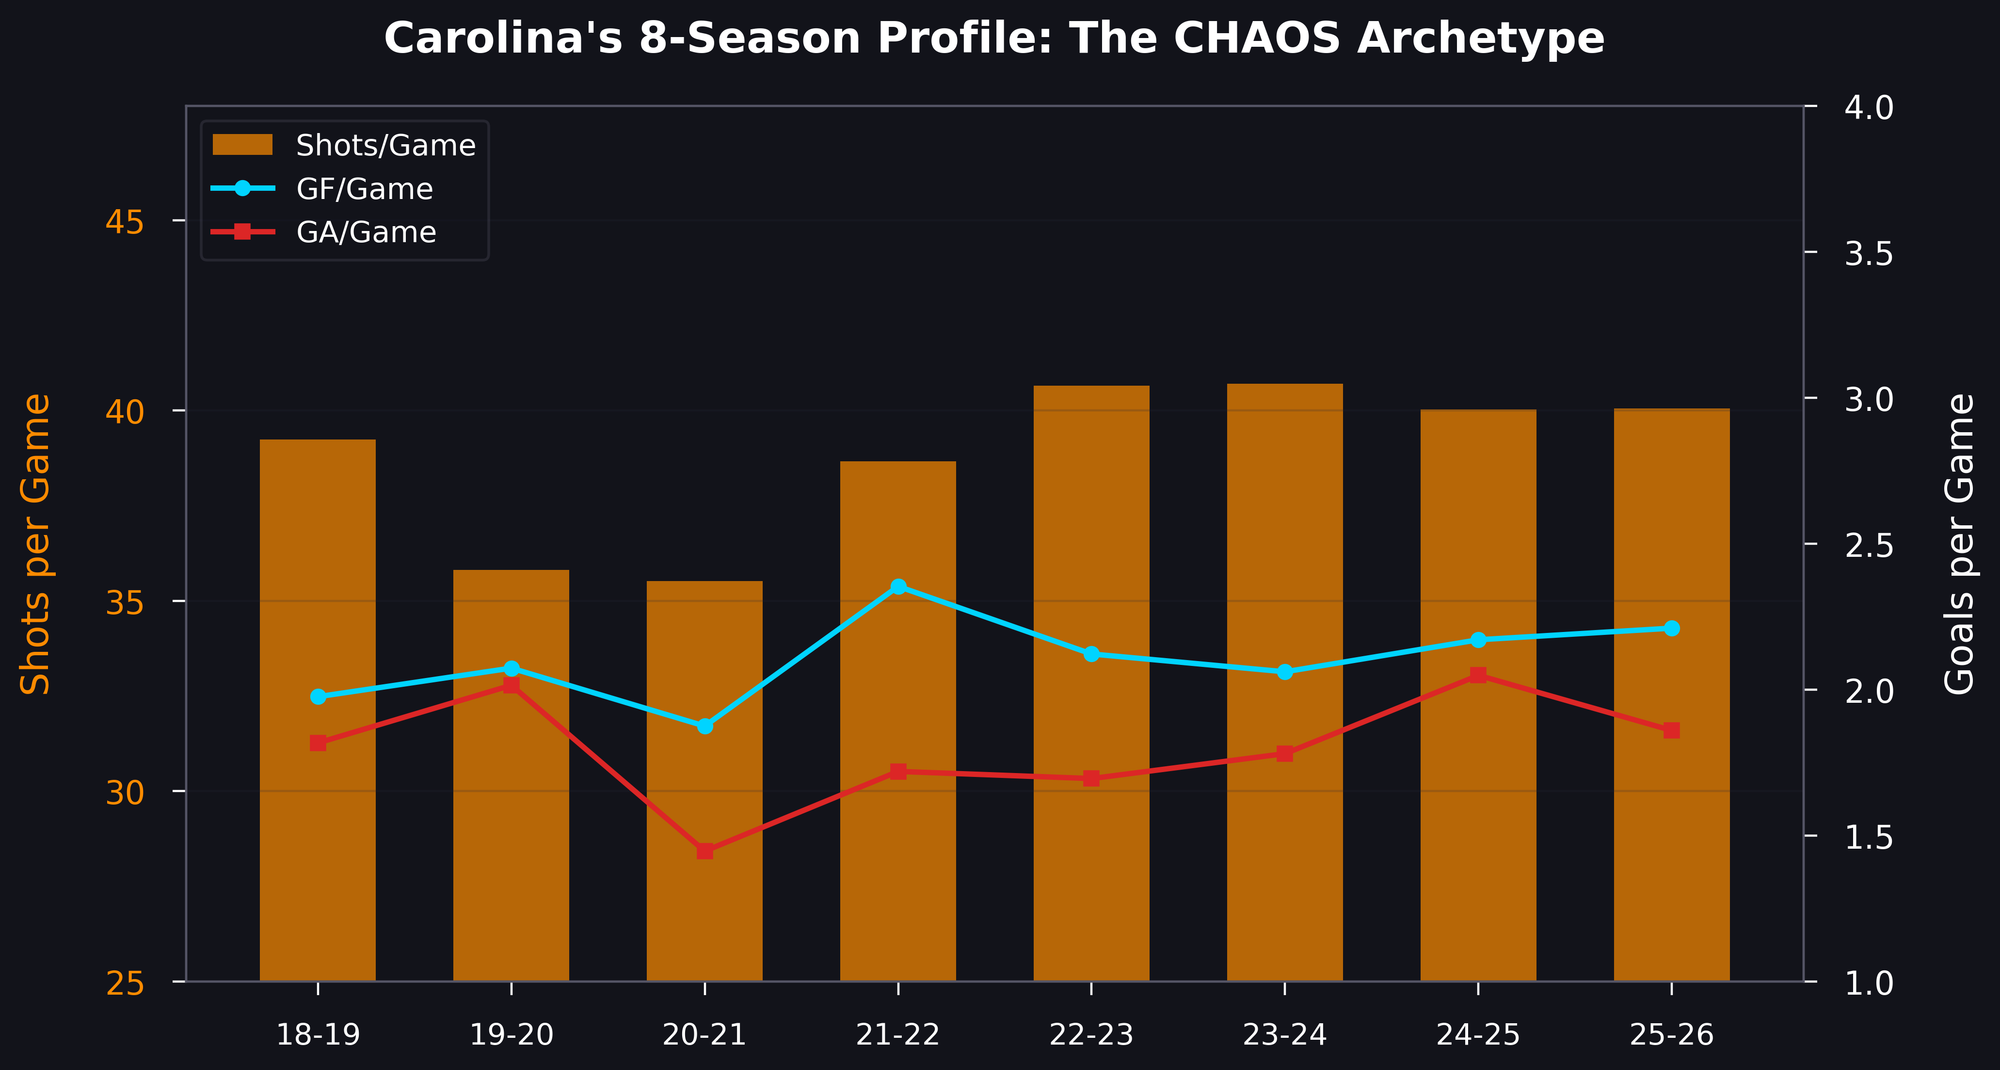
The Hurricanes have been classified CHAOS in seven of eight seasons. Their formula: shoot from everywhere, shoot constantly, overwhelm opponents with volume regardless of location. They regularly push toward 40 shots per game, season after season, from high-entropy locations that would make a shot-quality purist wince. It works well enough to sustain strong regular-season performance and repeated playoff qualification.
The Trap: Repeat Offenders
If SELECTIVE is a trap, some teams have been stuck in it for years:
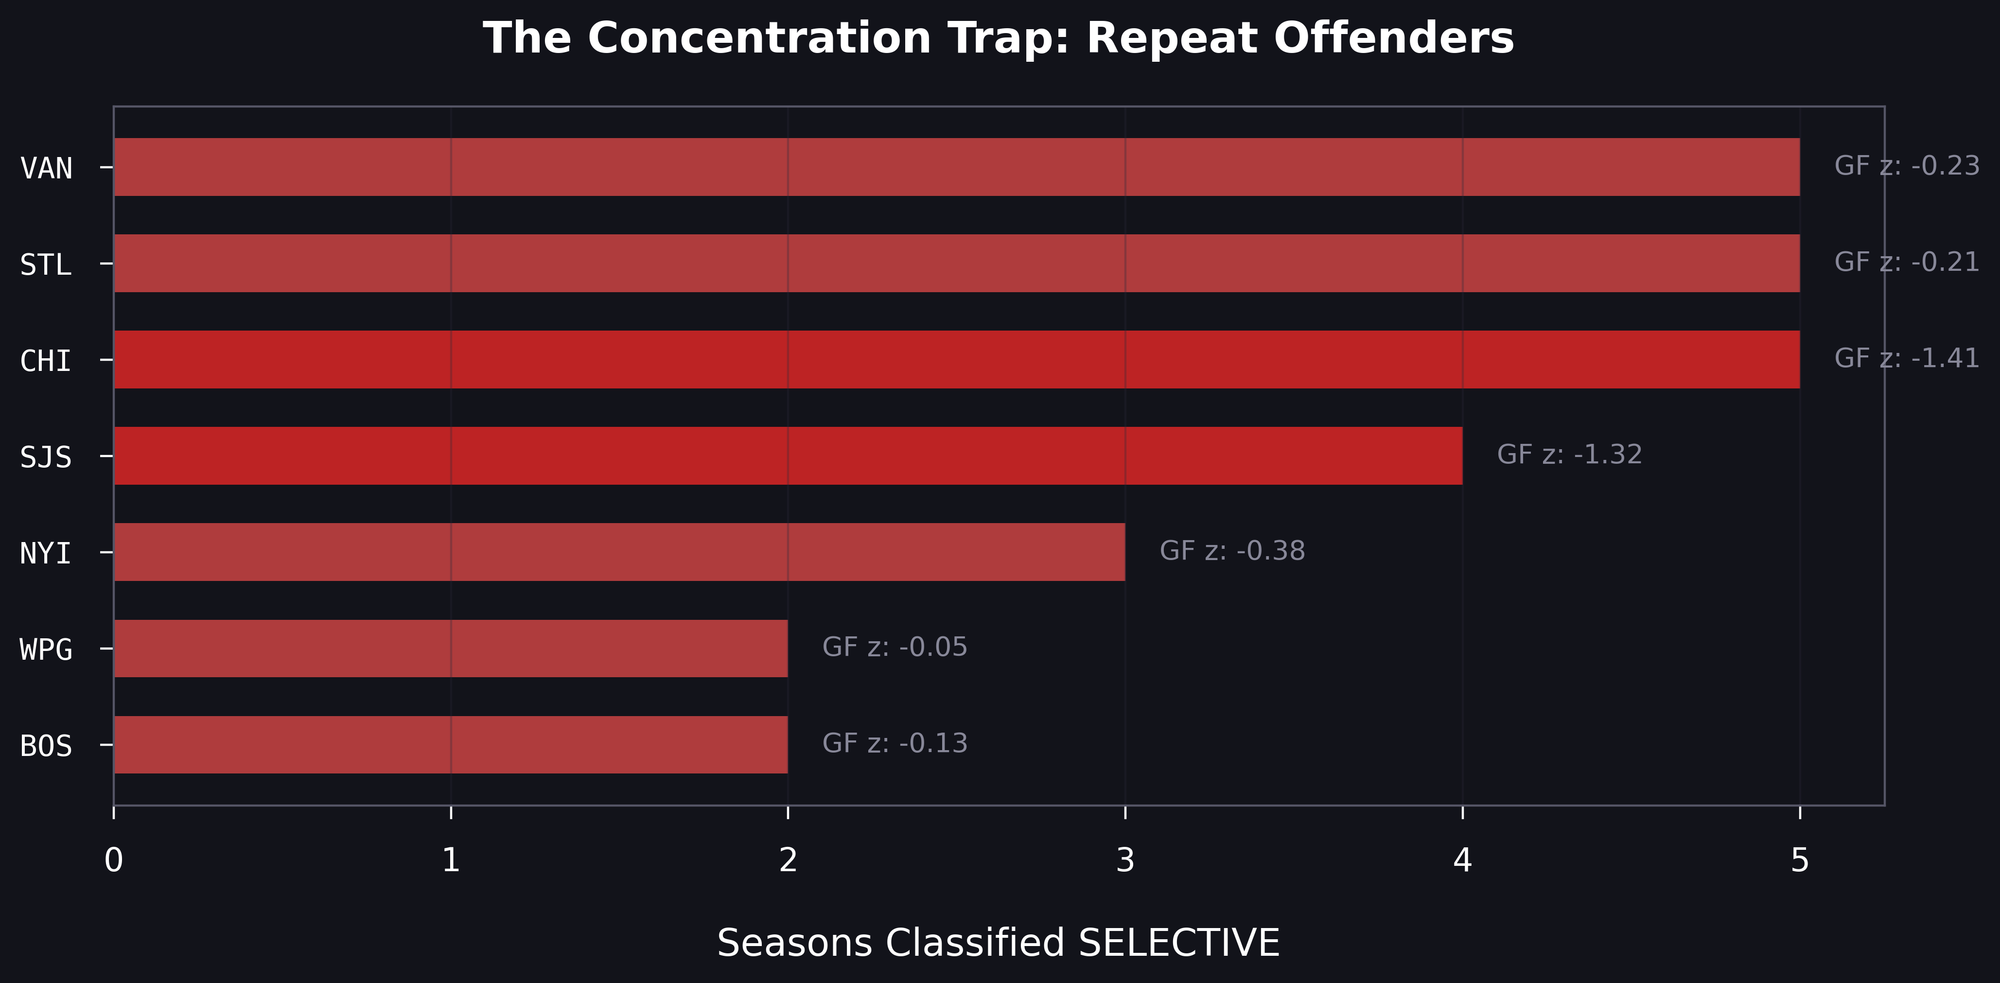
Chicago's numbers across five SELECTIVE seasons are staggering: their goals-for z-score averages −1.41 and their goals-against averages +1.40. Simultaneously among the worst offenses and worst defenses in the league, despite running what appears to be a disciplined system.
One plausible mechanism is possession. Teams that generate fewer shots likely spend less time in the offensive zone and more time defending. The shot concentration we observe may partly reflect discipline, but it may also reflect a limited ability to sustain possession long enough to create additional perimeter or secondary shot options.
Dallas illustrates that a SELECTIVE profile can be viable in a given season, but likely only when paired with elite goaltending and a defensive system that offsets low volume. Most teams do not have that margin.
What This Means
Shot quality matters. Concentrated shooting is associated with better expected goals per shot. But at the team level, the binding constraint appears to be shot generation more than per-shot quality. Shots are an imperfect but useful proxy for territorial control and offensive pressure. A team generating 40 shots per game from moderately good locations will often outperform a team generating 28 shots from excellent locations, because the higher-volume team tends to spend more time attacking and less time defending.
Entropy measures structure. Volume measures dominance. The NHL rewards dominance.
But if neither extreme entropy predicts success on its own, what do we make of Colorado, the most dominant team in hockey with a perfectly average entropy profile? That's Part 3: The Colorado Problem.
All data from MoneyPuck.com's shot-level dataset. 5v5 situations only. Archetype classification uses within-season z-scores with thresholds at ±0.5 SD for both location entropy and shots per game. The ±0.5 SD threshold was chosen to balance archetype distinctiveness with sample size; sensitivity analysis at ±0.75 SD produces similar directional performance gaps with fewer observations per extreme quadrant. Archetypes are descriptive bins for interpretation; the underlying volume–entropy relationship should also be evaluated on continuous scales.